Ransomware Payments Rise as Public Sector is Targeted, New Variants Enter the Market
Coveware’s Q3 Ransomware Marketplace report aggregates anonymized ransomware data from cases handled and resolved by Coveware’s Incident Response Team, and other Incident Response firms that utilize the Coveware Incident Response Platform to manage their own cases. Unlike surveys, which rely on sentiment, this report is created solely from a standardized set of data collected from every case. By aggregating and sharing this data we believe large and small enterprises can better protect themselves from the persistent and ever-evolving ransomware threat. Please don’t hesitate to reach out to us with any questions or comments. Thank you for reading!
How Much Does a Ransomware Attack Cost?
The total cost of a ransomware attack is a function of direct and indirect costs. Direct costs include the immediate remediation of the event, including the ransom if it must be paid. The indirect costs are the costs of business interruption associated with the attack. Business interruption costs are often 5-10x higher than direct costs. Lost revenue and long term brand damage are factors that weigh heavily on victims of ransomware who are not able to recover quickly.
What Is the Average Ransom Payment?

In Q3 of 2019, the average ransom payment increased by 13% to $41,198 as compared to $36,295 in Q2 of 2019. The rate of increase has plateaued reflecting resistance to paying by victims who are increasingly finding new ways to restore and recreate data, rather than pay. Ryuk continued to make headlines and other similar Hermes variants like DopplePaymer and I-Encrypt became more prevalent, suggesting that threat actors are rotating through different kits. The ransom payment increase also reflects the increase in demand from Sodinokibi and Globelmposter variants, both of which are targeting large Managed Service Providers (MSPs) and large enterprises with million dollar plus demands. In summary, the size, sophistication, and cost of these attacks, along with lower overall payment rate, indicates that threat actors are willing to invest significant time and expense for the prospect of a higher payoff.
How Much Downtime Does a Ransomware Attack Cause?

In Q3 of 2019, average downtime increased to 12.1 days, from 9.6 days in Q2 of 2019. The increase in downtime was primarily driven by the increased number of successful attacks against larger enterprises. Larger enterprises have more complex networks, and restoring data via backups or decryption takes longer than restoring the network of a small business. Additionally, database corruption or the loss of domain controllers at large organizations can add significant complexity to recovery efforts, which leads to more downtime. Common types of ransomware like Ryuk and Sodinokibi, are increasingly corrupting domain controllers and large SQL databases which can sometimes cause permanent data loss.
How Much Data Is Recovered After Paying a Ransom?
When a ransomware victim is forced to pay a ransom, there are two success metrics that determine the outcome. First, does the payment result in a working decryption tool being delivered? If the threat actor did not deliver then it is considered a default and will likely lead to a 0% data recovery rate. Second, if a working decryption tool is delivered then how effective is it in decrypting the data? Files and servers can be damaged during or after the encryption process and this can affect data recovery rates even when a decryptor tool is delivered.
How Often Is a Decryption Tool Delivered After Paying a Ransom?

In Q3 of 2019, 98% of companies that paid the ransom received a working decryption tool. This is up slightly from 96% in Q2. Payment success rates do vary across different types of ransomware and different threat actor groups. For instance, certain threat actor groups associated with Rapid and Dharma ransomware are known to consistently default after being paid. The ability to identify these threat actors before a victim pays is a major premium.
Do Ransomware Decryptor’s Work?

In Q3 2019, victims who paid for a decryptor successfully decrypted 94% of their encrypted data. Data recovery rates increased slightly. This statistic varied dramatically depending on the ransomware type. For example, Mr. Dec Ransomware had an abysmal data recovery rate, around 30%. This is due to the caustic nature of the payload, mixed with the relatively amateur threat actors that use it. The result is sadly predictable. On the other hand, ‘Mamba’ ransomware has an almost 100% data recovery rate. Mamba actors use full disk encryption after gaining a persistence in the network rather than black market encryption malware. Since the full disk encryption software they use is commercially manufactured, rather than black market manufactured, it tends to cause less damage.
What Cryptocurrencies Are Used to Pay for Ransomware?

Bitcoin remains the dominant cryptocurrency used for ransomware payments. Ransomware actors have greatly benefited from the development of consumer and business services within the cryptocurrency speculation market. If victims had a hard time procuring cryptocurrency, criminals would be equally challenged monetizing the attacks. It is very common for ransomware notes to include in-depth instructions on how to obtain cryptocurrency quickly. This is an example of the effort criminals must exert towards solving this problem for their victims. The use of more esoteric privacy coins would likely lower attack conversion rates for the criminals, so they stick with Bitcoin.
What Are the Most Common Types of Ransomware?

In Q3 2019, Dharma/Phobos, Ryuk and Sodinokibi all held between 20-30% of the market share of enterprise attacks. The most notable change in Q3 was an increase of new ransomware variants. At the small enterprise-level, variants such as Snatch, Estemani, Hidden Tear, and Netwalker have appeared and are proving to have staying power. At the larger enterprise-level, variants such as Defray 777 and Ryuk cousins, DopplePaymer and I-Encrypt, have continued to target very large enterprises.
What Industries Are Commonly Targeted by Ransomware?

In Q3, public sector organizations accounted for over 13% of incidents, an increase from 3% in Q2. The media’s attention was warranted as this sector came under assault during the quarter. No other sector experienced a change of such magnitude, and the attention that both federal and state lawmakers are paying to the problem is warranted. Until these organizations are able to rightsize their IT security budgets and IT headcount, these attacks will certainly continue.
What are the Most Common Ransomware Attack Vectors?

In Q3 2019, ransomware distributors continued to exploit common reliable attack vectors. At the small enterprise-level, vulnerable RDP ports continued to be a cheap and reliable way for distributors to penetrate companies. It is increasingly common for victims of Remote Desktop Protocol (RDP) based attacks to find their stolen credentials for sale on marketplace forums, even after their attack. The rise of MSP based attacks also evolved during the quarter. In Q3, affiliates of Sodinokibi amplified the volume and magnitude of their attacks on IT managed service providers (MSPs). In these attacks, the ransomware was pushed to every endpoint of the MSP’s clients. This produced a devastating situation for both the MSP and end clients. In Q2, these attacks focused on software vulnerabilities in popular MSP RMM tools. While most MSPs were quick to patch these vulnerabilities, they were not quick to adopt 2FA on their management tools, and have been increasingly targeted by phishing attacks. Once inside, the attackers push their ransomware delivery scripts via direct access to these RMM tools via lifted credentials.
Comparing the Top Three Types of Ransomware

Ransomware attack patterns change year over year, but month to month vary only slightly. When attackers find cost efficient methods to penetrate large populations of companies, they repeatedly exploit these avenues until they dry up. In Q3, there were only mild shifts in attack patterns among the top three types of ransomware. At the lower end of the market, Dharma continued to exploit compromised RDP credentials. These attacks have become so commodicized that non-technical attackers can easily carry them out with the proper guidance (often in the form of a generic 1-pager provided by the seller of the ransomware kit). At the top end of the market, Ryuk continues to focus on bespoke attacks with email phishing being the primary point of initial compromise. The only major shift was Ransomware-as-a-service Sodinokibi, which continued to focus on attacking IT managed service providers, but shifted towards both RDP and email phishing to gain entry to their targets.

The size of victim companies can indicate where a specific variant is focusing their efforts. In Q3, we noticed a shift in Ryuk attacks, indicating that the ransomware code had been shared with a wider audience of attackers. These groups had uniquely different personas than the groups in Q2 since they targeted smaller companies. It flowed through to the data with the average Ryuk victim company size dropping from over 3,000 employees to about 1,000. On the other hand, Sodinokibi amplified their attack targets and went further upstream. During Q2, Sodinokibi appeared to have been downmarket testing on smaller companies. Once the testing phase was over, the affiliate groups began targeting larger MSPs and organizations. The average Sodinokibi ransomware victim size increased from 79 employees to 284.

Despite its push downmarket, large Ryuk victims were subjected to increasingly large ransom demands in Q3. The average Ryuk ransom demand increased from $267,742 to $377,026 in Q3. Sodinokibi also dramatically increased its average ransom payment as it scaled into larger size attacks. The average Sodinokibi ransom increased dramatically as the affiliates launched large scale attacks against larger end clients. Sodinokibi also altered its demand strategy for MSP based attacks. Unlike in Q2, when an MSPs end clients were attacked, the end clients were no longer permitted to purchase decryption keys for their own ID’s. Instead, the attackers demanded that the MSP purchase a master key, at great expense, to unlock all of their end clients.
What Was the Average Size of Companies Targeted by Ransomware?
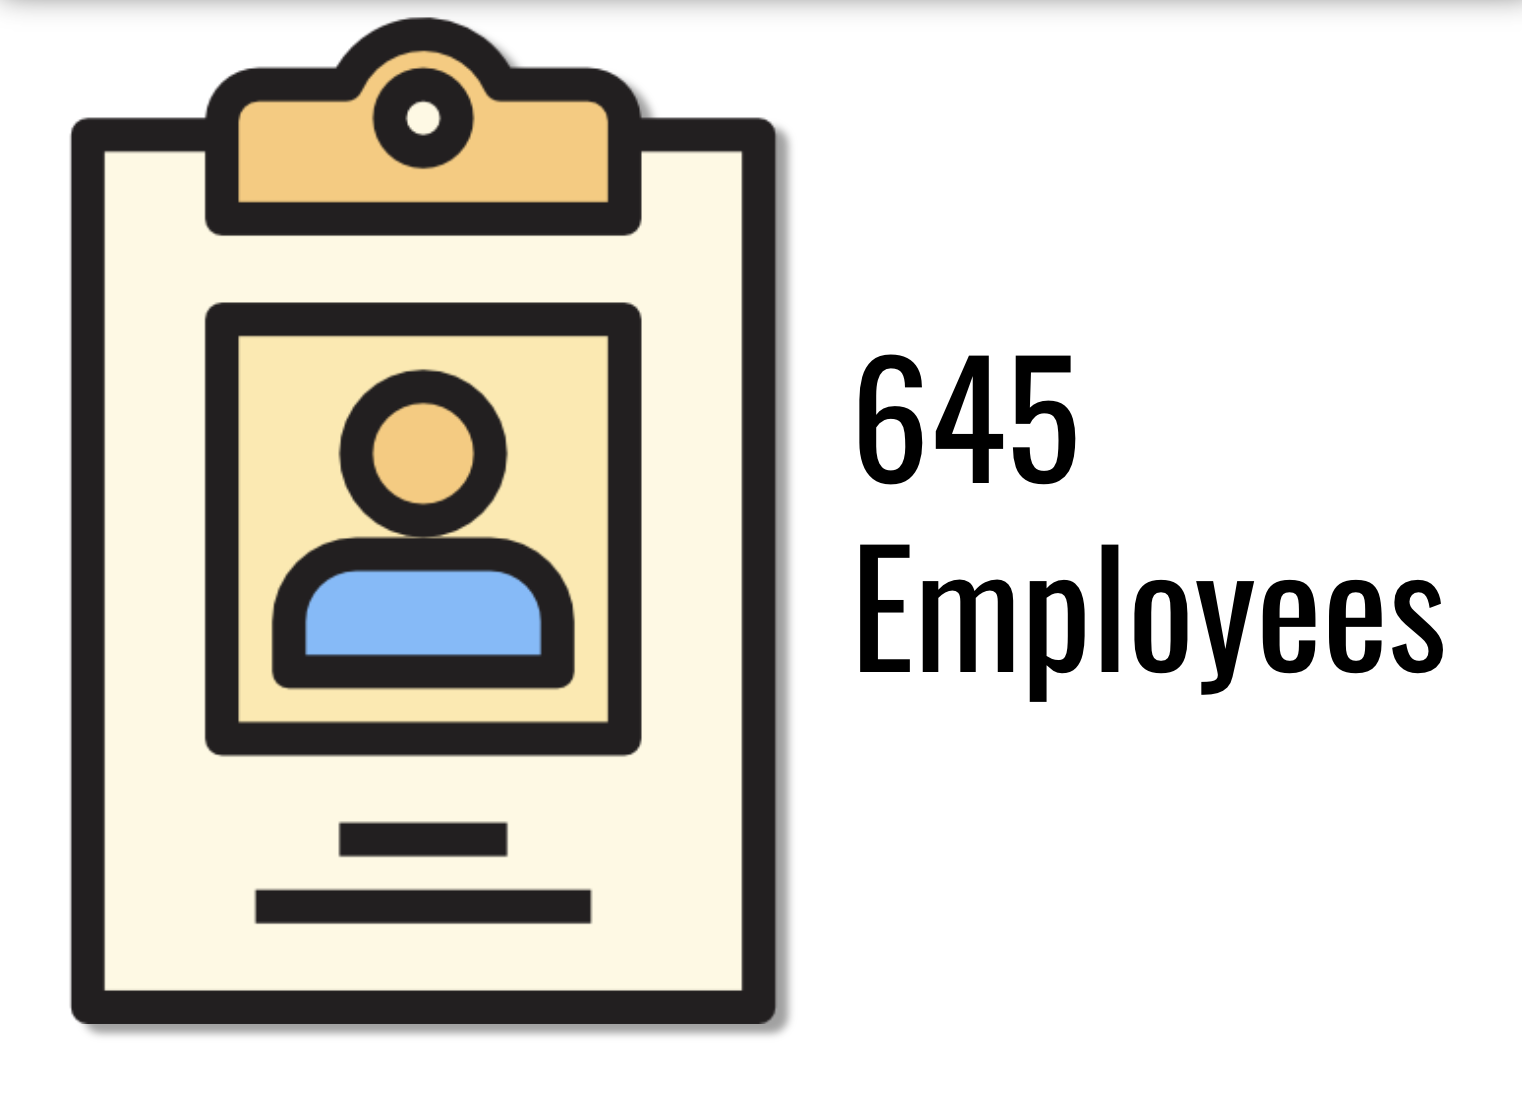
In Q3 of 2019, the average company size decreased to 645 employees, down from 925 in Q2. This decrease reflects the down market attention of Ryuk and other Hermes variants, despite the ransomware-as-a-service affiliate population targeting their attacks at larger enterprises.
————————
Disclaimer:
Coveware is not responsible for any actions taken, errors or omissions (negligent or otherwise), regardless of the cause, or for the results obtained from the use of this content, or for the performance of any computer, hardware or software used or modified in conjunction with this content. The content is provided on an "as is" basis.
VIEWERS OF THIS REPORT AND ITS CONTENT DISCLAIM ANY AND ALL EXPRESS OR IMPLIED WARRANTIES, INCLUDING, BUT NOT LIMITED TO, ANY WARRANTIES OF MERCHANTABILITY OR FITNESS FOR A PARTICULAR PURPOSE OR USE, FREEDOM FROM BUGS, SOFTWARE ERRORS OR DEFECTS, THAT THE CONTENT'S FUNCTIONING WILL BE UNINTERRUPTED OR THAT THE CONTENT WILL OPERATE WITH ANY SOFTWARE OR HARDWARE CONFIGURATION.
In no event shall Coveware be liable to any party for any direct, indirect, incidental, exemplary, compensatory, punitive, special or consequential damages, costs, expenses, legal fees, or losses (including, without limitation, lost income or lost profits and opportunity costs or losses caused by negligence) in connection with any use of the content even if advised of the possibility of such damages.
Some images designed by ITIM2010 from Flaticon.