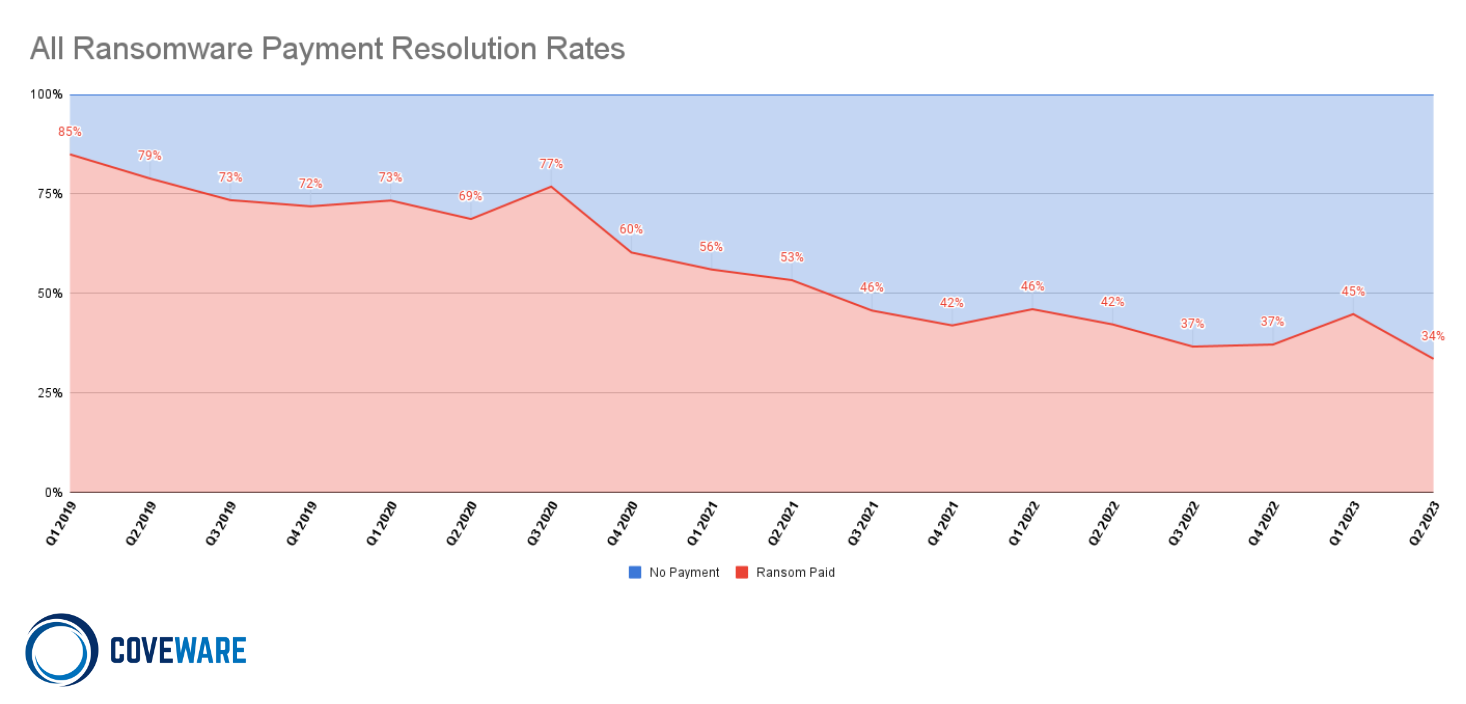
Ransom Monetization Rates Fall to Record Low Despite Jump In Average Ransom Payments
In the second quarter of 2023, the percentage of ransomware attacks that resulted in the victim paying, fell to a record low of 34%. The trend represents the compounding effects that we have noted previously of companies continuing to invest in security, continuity assets, and incident response training. Despite these encouraging statistics, ransomware threat actors and the entire cyber extortion economy, continue to evolve their attack and extortion tactics.
Understanding the action-reaction shifts within an economy first requires us to understand how different threat actor (TA) groups operate, why they use certain TTPs and why different cohorts of victims are impacted. Our best depiction is the cyber extortion opportunity cost curve.
Cyber Extortion Opportunity Cost Curve
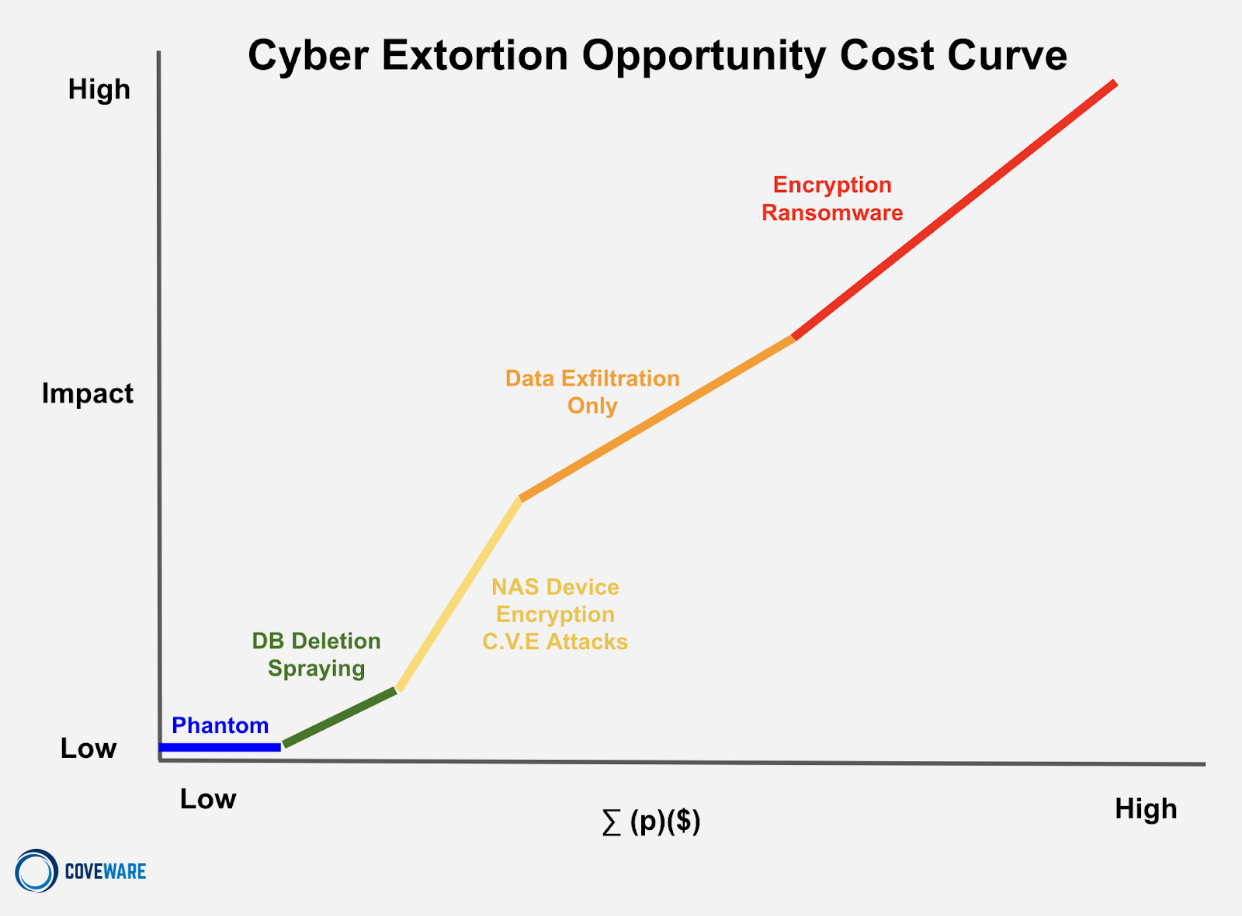
This model links five discrete examples of extortion strategies whose characteristics and unit economics all occupy different areas of the opportunity cost curve. By standardizing the variables used to measure different strategies, we can begin to understand how a single broad statistic, like a decreasing aggregate monetization rate, affects the curve in different ways.
The vertical axis of the curve charts the financial impact felt by the victim of the attack. Business disruption is the largest driver of victim impact and we note that impact is proportional to the EFFORT a threat actor must exert in order to carry out the attack. Lower effort leads to lower impact felt by the victim. The greater the effort, the higher the impact. Impact is correlated and proportionate to the costs a threat actor incurs to carry out an attack.
For example, if a TA uses previously leaked credentials to steal a single file from a single machine of a sole proprietorship with a single employee, the impact is very low. The costs the threat actor incurred were also very low. On the other end of the spectrum, if a threat actor spent $500,000 to acquire a 0-day vulnerability and it then takes 4 weeks of manual reconnaissance work and lateral movement before impact and extortion, we can see how expensive a single attack may become. Threat actors that spend this much on a single attack will likely calculate a very high demand in an effort to recoup their costs and turn a profit.
The horizontal axis is the total expected profit to the threat actor. It is a product of multiplying the probability that an attack will result in a ransom being paid (p), multiplied by the actual amount of the ransom that may be paid ($). The sum of all the expected profits adjusted by probability is represented by this horizontal axis.
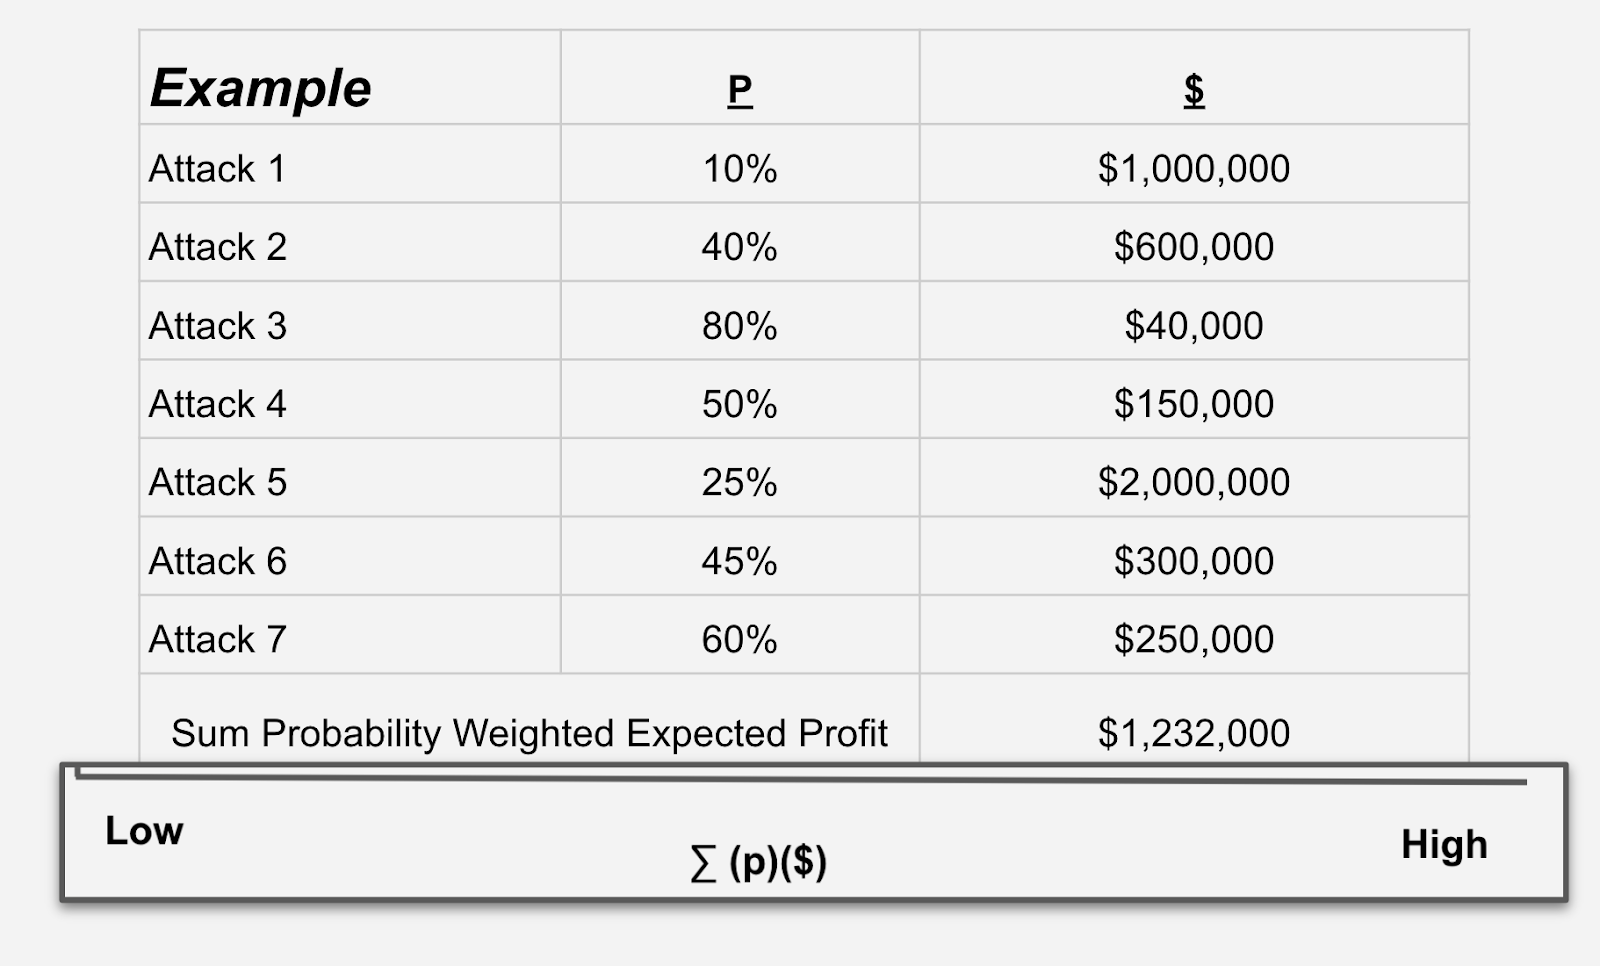
To illustrate this, let’s take an example of a threat actor that will carry out 7 attacks. Each attack carries a unique probability that the conclusion will generate a ransom payment, and each attack has an expected ransom payment. The probability of getting paid will vary based on the impact of the attack, the type of company impacted and other variables. The ransom payment is also a function of impact but also the size of a victim.
A small dentist office with no backups that is 100% encrypted feels very high impact, but may only be able to pay a small ransom. So the probability of payment is high, but the $ amount is low. On the other hand, an attack against a very large public company may be too expensive to create material impact, but will come with a very high demand. So the probability is low of a payment, but the amount of the payment, if made, is very high. We multiply probability by expected payment, and by aggregating the attacks, we can create an expected payment profile that averages out to a level commensurate with the effort (cost) and impact caused by the attack. We can now look at how different attacks create a curve between these axes.
Phantom Incidents
- Impact = zero
- (p) = zero / low
- ($) = low
- ∑ (p)($) = zero / low
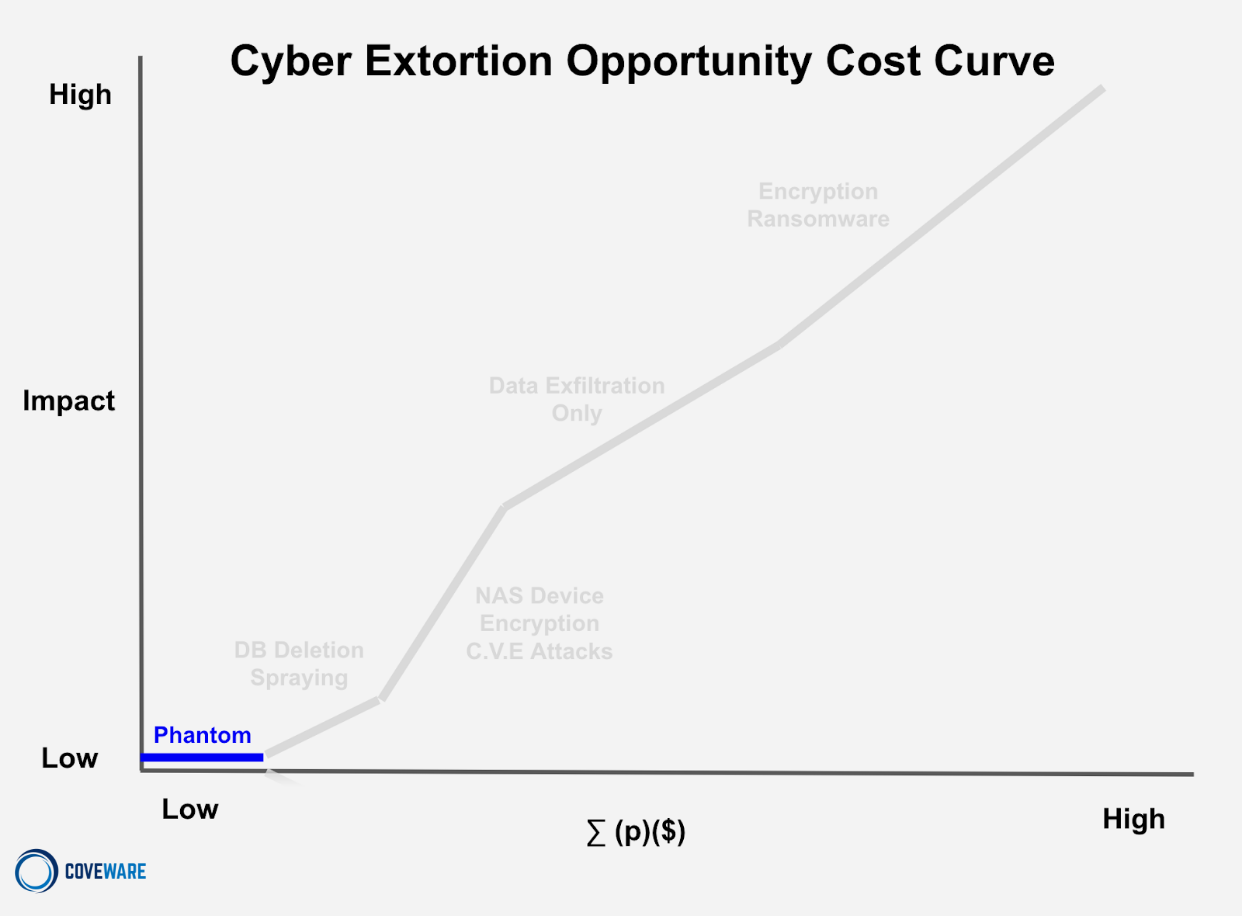
Phantom incidents are essentially mass orchestrated social engineering attempts. They engineer legitimacy in different ways and make very modest demands in the hope that no one will actually check closely or do a cost/benefit analysis since the demand is so low. The impact to the company is almost always nothing. The expected payout is also low as (p) probability of payment is very low since companies rarely fall for these scams. The $ demand is low ($1-5k). BUT these attacks are very cheap to pull off programmatically, so the TA’s are not investing much time, money or effort which still makes the unit economics of these attacks positive, albeit low on an absolute level.
Database Deletion – Spray Attacks
- Impact = zero/low
- (p) = low
- ($) = zero/low
- ∑ (p)($) = zero/low
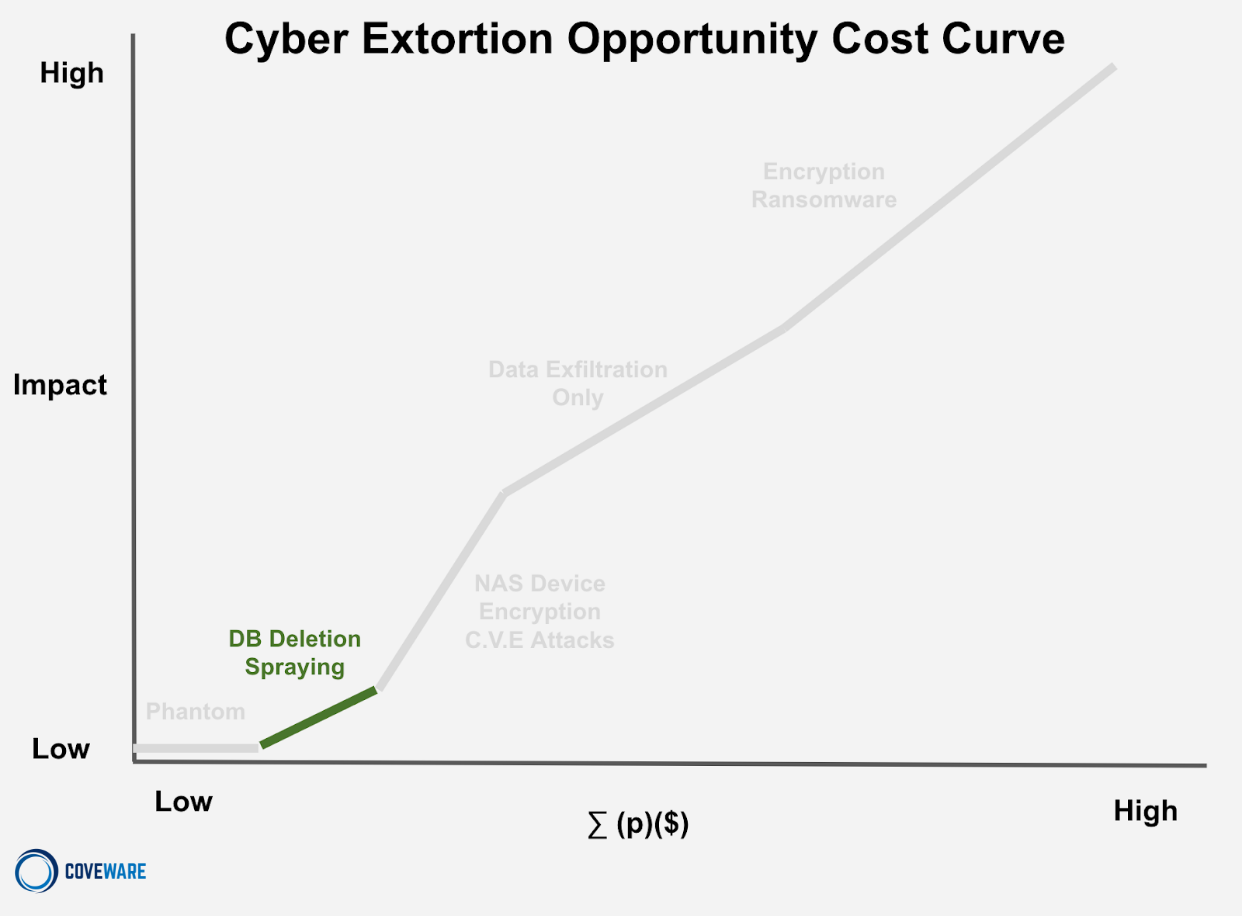
Next up are database deletion ‘spray’ attacks. These are a slight step above Phantom incidents, but not by much. Database deletion attacks carry some of the same tactics of phantom incidents (engineered legitimacy, social pressure, asymmetric price), but are not TOTAL scams. The database IS actually wiped. BUT, it is also not recoverable in any way and was certainly not exfiltrated. Depending on the nature of the data, this type of intrusion may cross the definition of ‘unauthorized access’ and necessitate notifications.
NAS Device Encryption CVE Attacks
- Impact = low/medium
- (p) = medium
- ($) = low
- ∑ (p)($) = low/medium
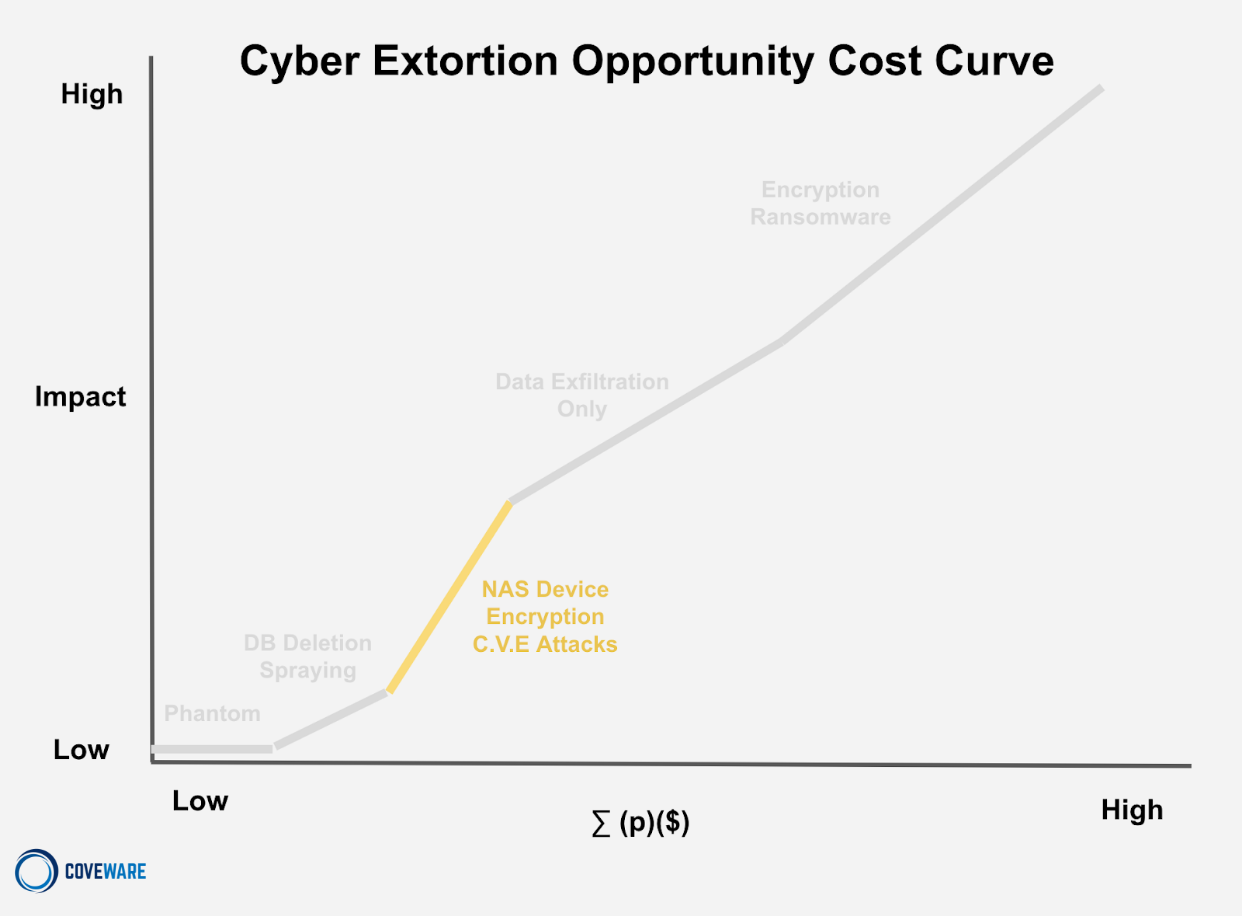
NAS (Network Attached Storage) encryption attacks leverage similar mass scanning techniques as database deletion attacks. These mass exploits scan for common NAS storage devices that tend to be internet connected with weak security configurations and lax patch management schedules. The scanning and deployment of payloads tend to be automated so the threat actor can scale the costs of impacting lots of NAS devices at lots of companies. CVE mass exploits typically target peripheral NAS devices, but can also impact common on-prem devices like Jira/Confluence servicers. These attacks have real impact as the victim does experience encryption on these assets. The automated nature results in many failed attacks, which makes (p) low. To scale operations, the TA’s typically do not negotiate (as staffing active negotiating creates operational costs), so they set a relatively low fixed rate to coerce payment ($).
Data Exfiltration Attacks
- Impact = low/ medium / high
- (p) = low/medium
- ($) = medium/high
- ∑ (p)($) = medium
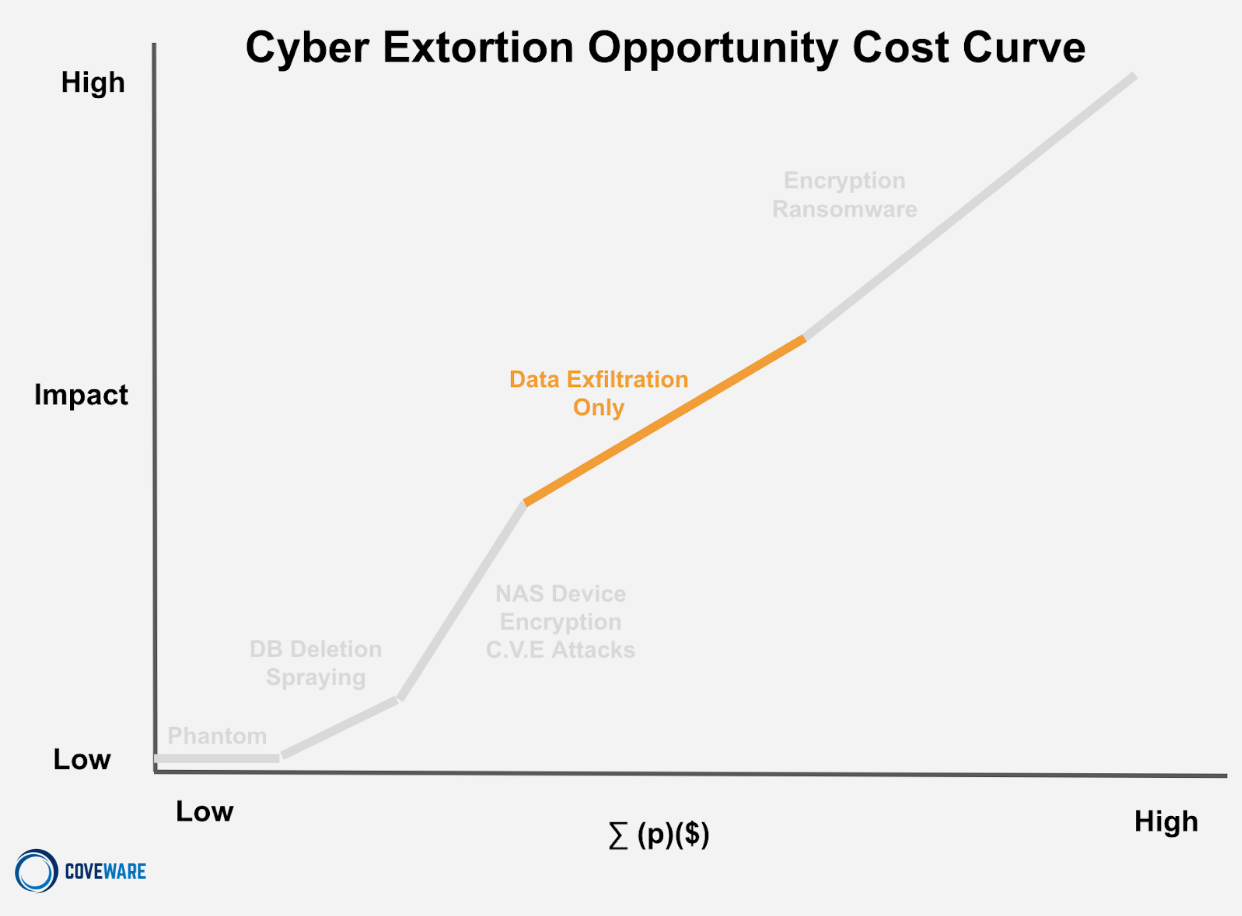
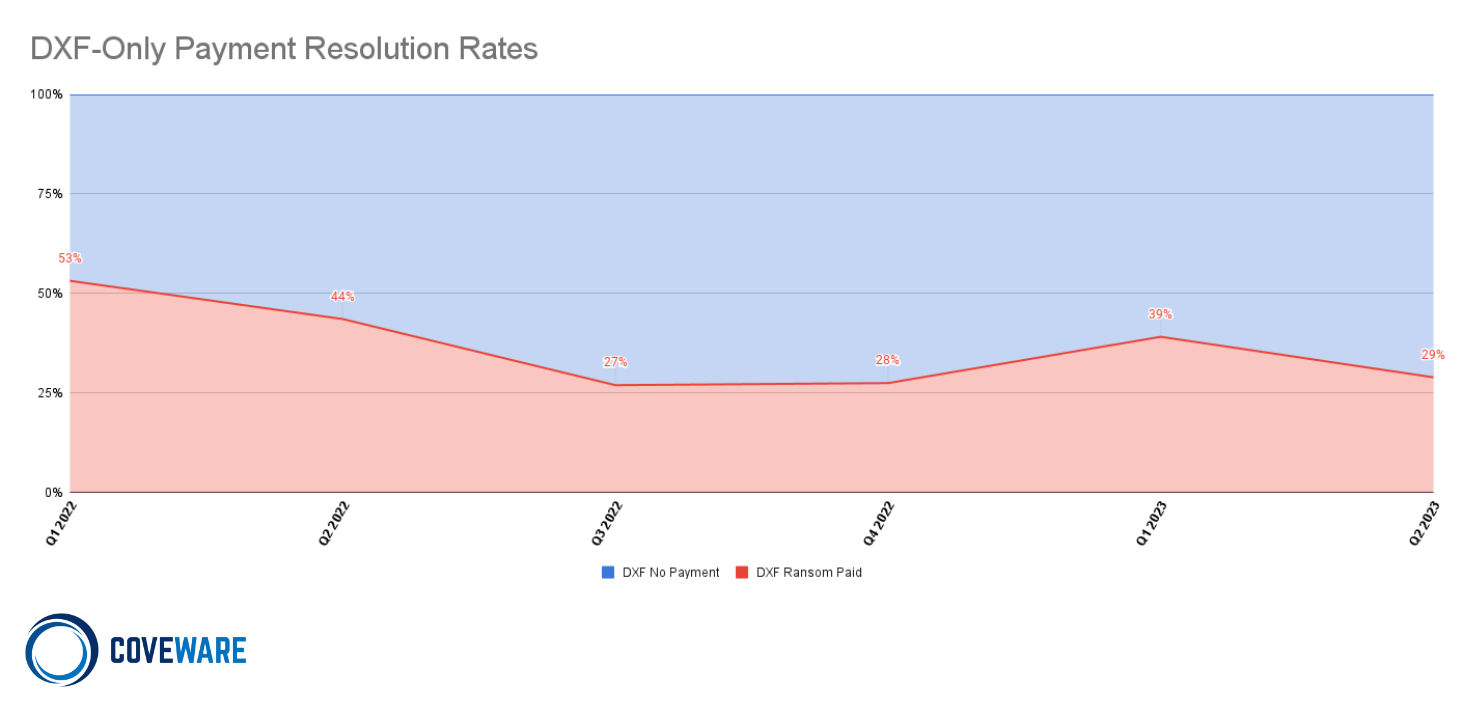
In data exfiltration only (DXF) attacks, the threat actor only steals data, and extorts the victim over its public release. There is no encryption or impact to the integrity or performance of business operations (with the exception of intermittent interruption resulting from containment efforts which may involve system shutdowns or network isolation). DXF-only attacks do not cause material business disruption like encryption impact but can cause brand damage and create notice obligations. The probability of a ransom being paid is less than 50%, but the ($) of a ransom demand on DXF only attacks is relatively high. This creates a medium level of expected profit on average, BUT this is an area of the curve that experienced a major shift in Q2 as the CloP ransomware group executed their monetization campaign against MOVEit users.
The success rate of extorting victims in DXF-only attacks has been turbulent, but dropping as we see in the below chart. As we have discussed in prior quarterly reports, paying threat actors to suppress the proliferation of data that was stolen has, at best, de minimis benefit.
In response to this, the CloP group made a material shift in the MOVEit campaign, and dramatically increased the average demand it made of victims. While the MOVEit campaign may end up impacting over 1,000 companies directly, and an order of magnitude more indirectly, a very very small percentage of victims bothered trying to negotiate, let alone contemplated paying. Those that did pay, paid substantially more than prior CloP campaigns, and several times more than the global Average Ransom Amount of $740,144 (+126% from Q1 2023).
Average Ransom Payment
$740,144
+126% from Q1 2023
Median Ransom Payment
$190,424
+20% from Q1 2023
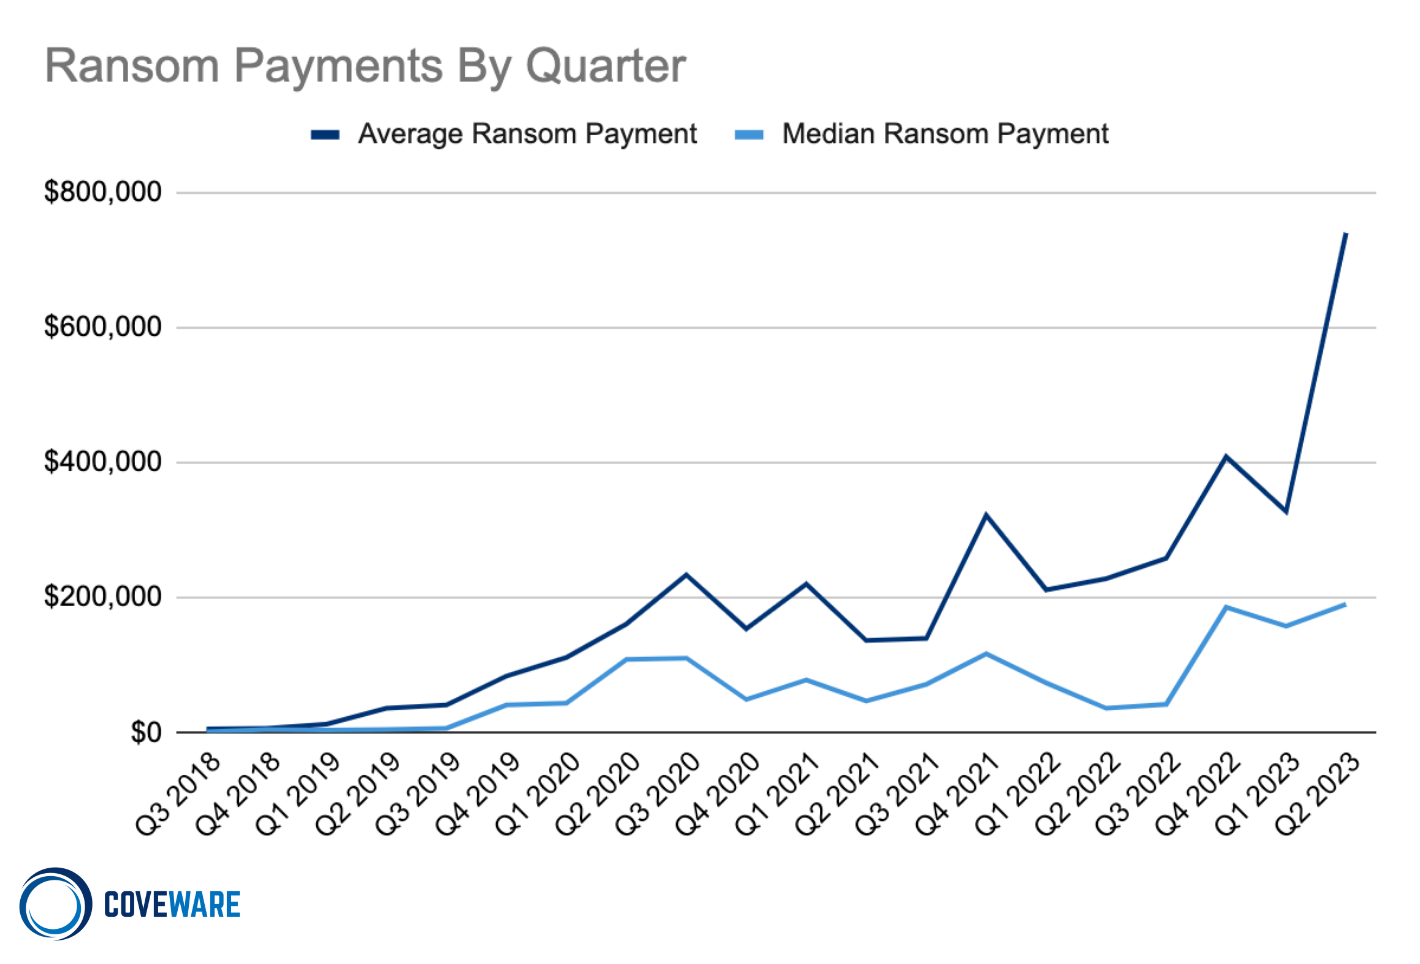
The reaction of CloP and other actors that target very large enterprises dragged the global average up dramatically despite a meager increase in the median payment (Median Ransom Amount: $190,424 (+20% from Q1 2023). It is likely that the CloP group may earn $75-100 million dollars just from the MOVEit campaign, with that sum coming from just a small handful of victims that succumbed to very high ransom payments. This is a dangerous and staggering sum of money for one, relatively small group to possess. For context, this amount is larger than the annual offensive security budget of Canada.
Encryption Ransomware
- Impact = high
- (p) = high
- ($) = high
- ∑ (p)($) = high
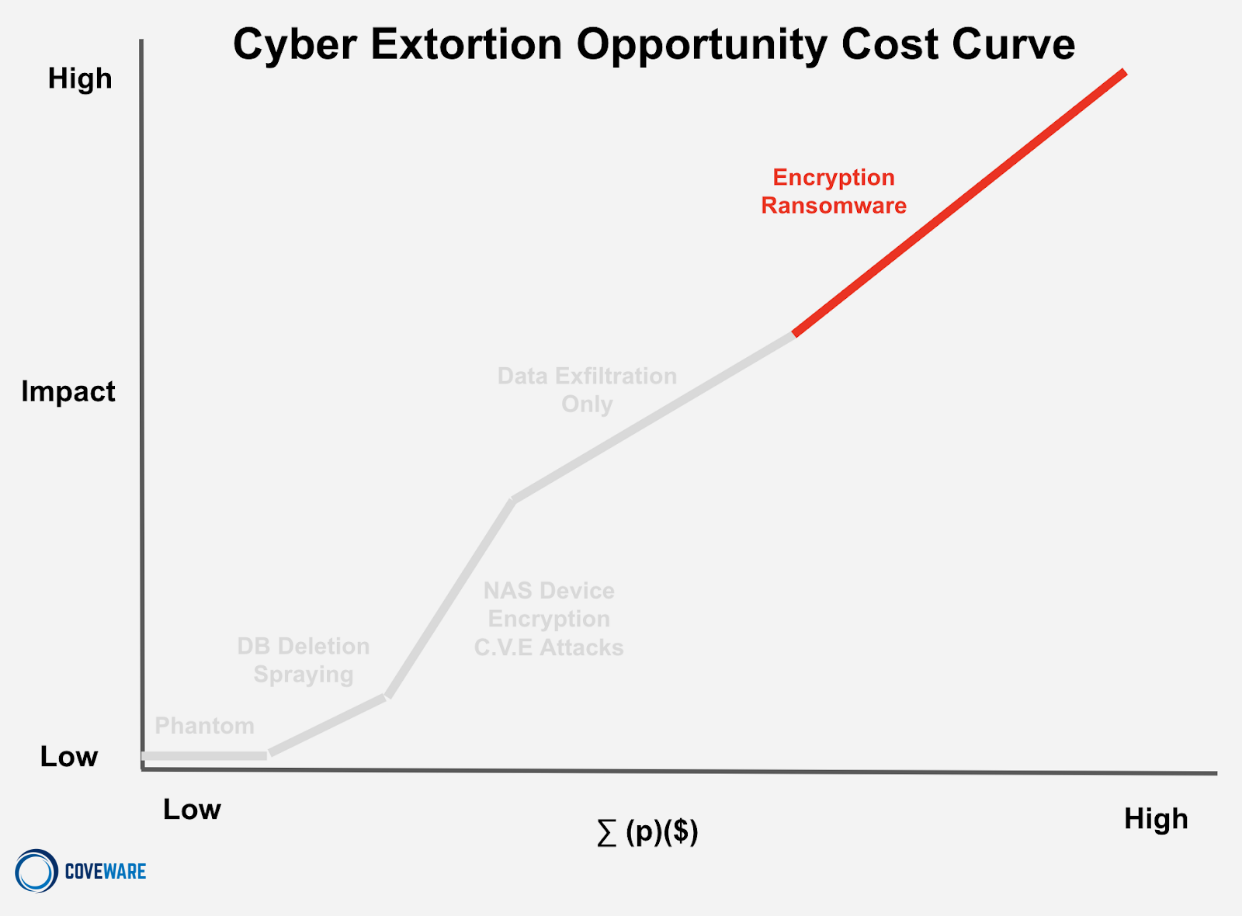
Encryption ransomware involves the MOST amount of threat actor work/costs. Encryption causes the highest level of impact to victims, and correspondingly has the largest expected profit to the threat actor. Causing major impact involves major costs. The threat actor must acquire access to a victim company’s network, which creates upfront costs. They must skillfully navigate the victim’s network through privilege escalation, lateral movement…etc in order to enumerate the assets and take control of critical machines, like domain controllers. This takes time and skill (opportunity cost per hour is HIGHER for highly skilled actors / teams). The skills to do this may come from multiple members of a threat actor group, so the costs are magnified by the number of people associated with the labor. This also means any potential ransom must be split several ways, which decreases potential profit if a ransom is paid.
Most Commonly Observed Ransomware Variants in Q2 2023
In Q2, we saw a dramatic reduction in encryption attacks from RaaS groups that target small enterprises. As successfully getting paid from an encryption attack has become harder, there have been two reactions. First, groups like Dharma and Phobos – ransomware families that have historically held a spot in the top 10 most active groups quarter over quarter for years – have become dormant. According to ID Ransomware data, Dharma/Phobos attacks are down on the order of 37% year to date 2023 versus the same period in 2022.
| Rank | Ransomware Type | Market Share % | Change in Ranking from Q1 2023 |
|---|---|---|---|
| 1 | BlackCat | 15.5% | – |
| 1 | Black Basta | 15.5% | +1 |
| 2 | Royal | 10.1% | – |
| 3 | Lockbit 3.0 | 6.2% | +1 |
| 4 | Akira | 5.4% | New in Top Variants |
| 5 | Silent Ransom | 3.1% | New in Top Variants |
| 5 | Cactus | 3.1% | New in Top Variants |
Second, it was observed that the more technically sophisticated affiliates that previously used both Dharma and/or Phobos have begun using a new Ransomware kit called 8base.
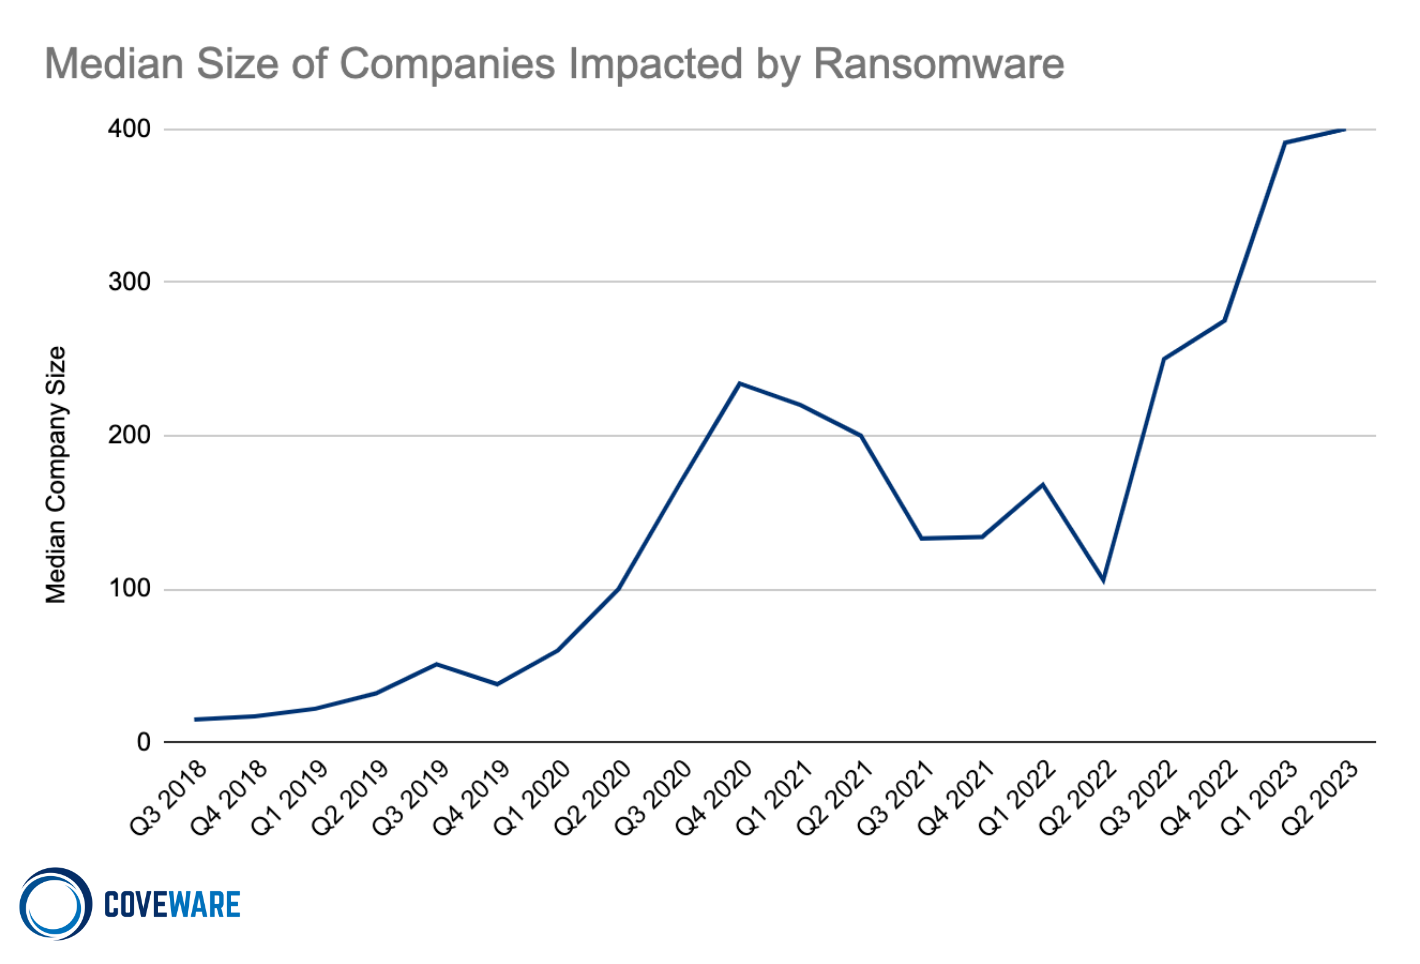
As adequate ransom payouts become more scarce, threat actors are modifying their behavior by both shifting their tactics (as we have seen with CloP), shifting their tools (as we see with Dharma/Phobos), and shifting their targets, as we see below with the median victim continuing to rise.
Ransomware Attack Vectors and TTPs
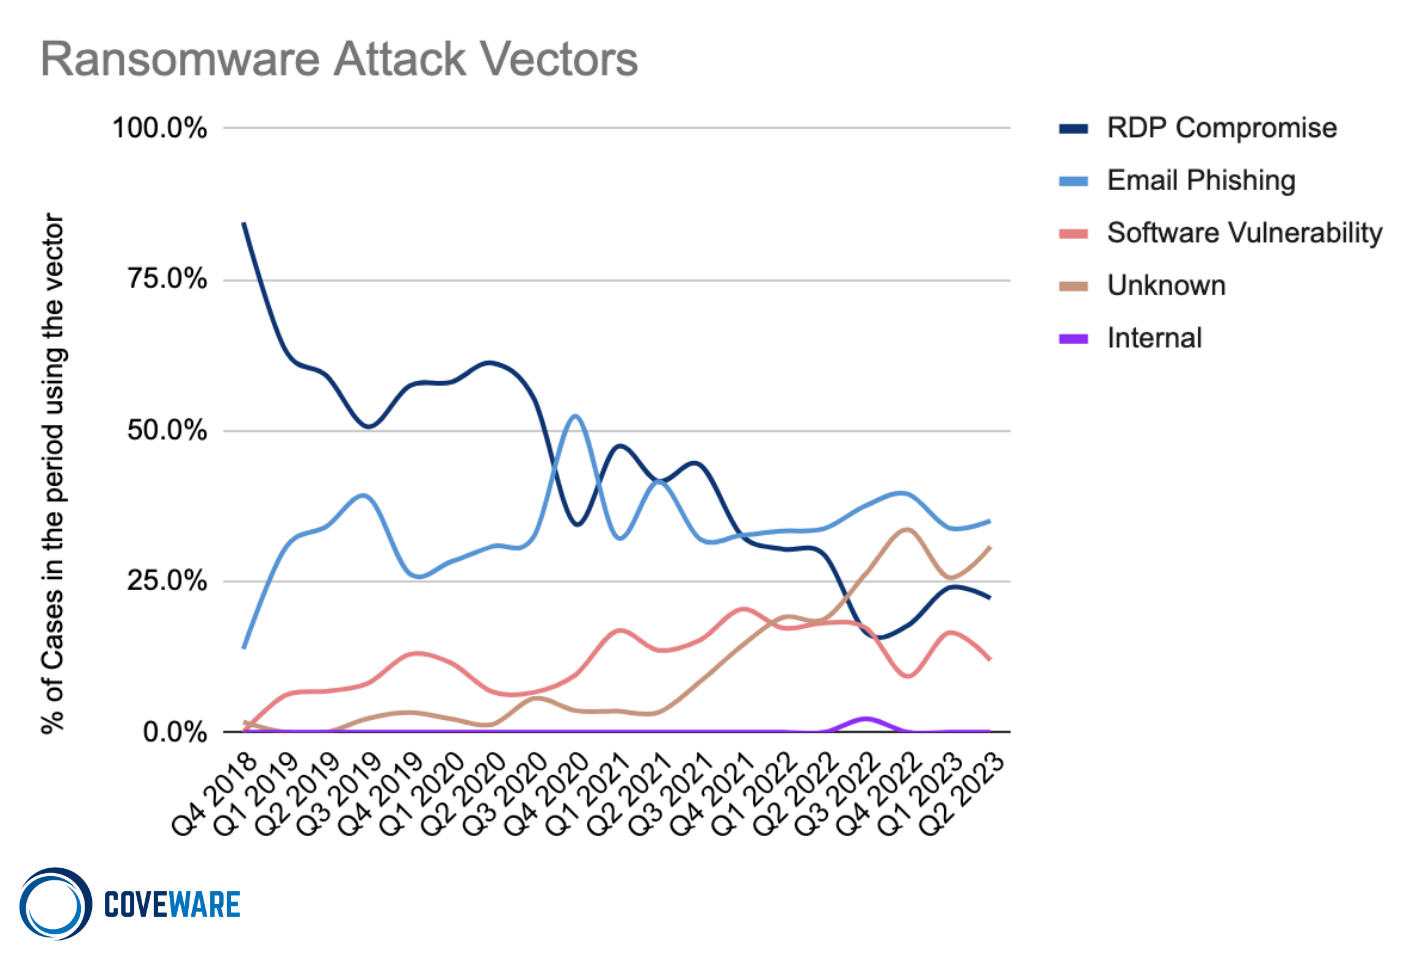
As the unit economics of cyber extortion shift, attack vectors and TTPs shift. Threat actors are increasingly “living off the land”, but demonstrated by CloP, the fields are far more fertile for some groups vs. others.
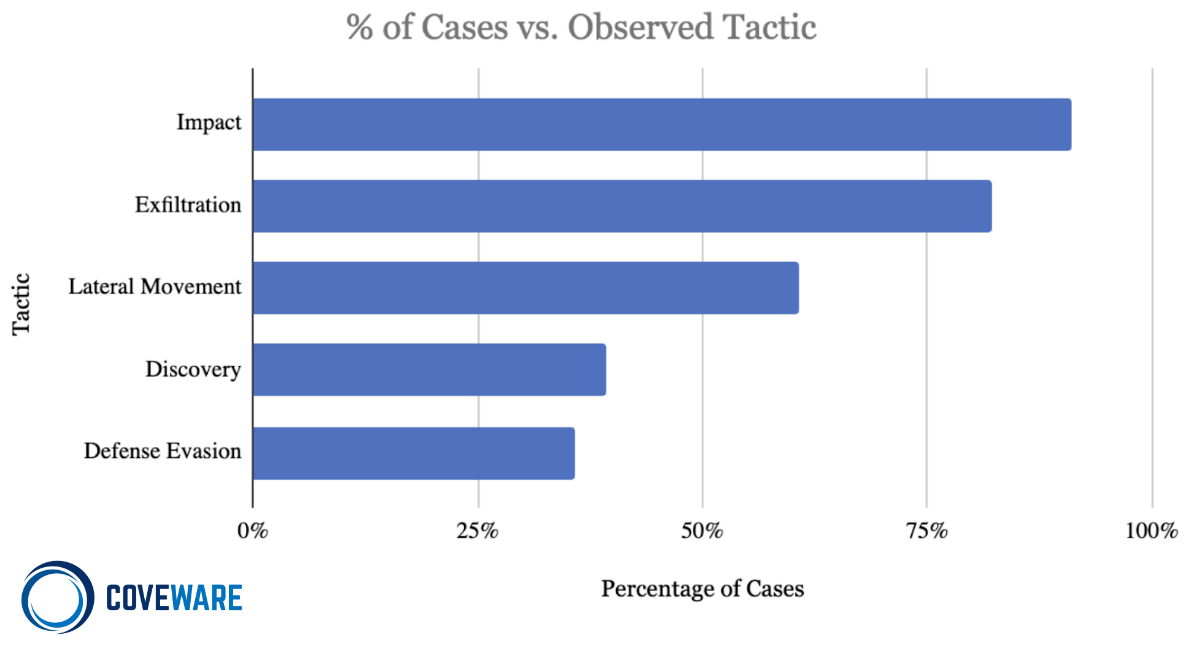
Impact: [TA0040] Impact consists of techniques used by adversaries to disrupt the availability or compromise the integrity of the business and operational processes. Techniques used for impact can include destroying or tampering with data. In some cases, business processes can look fine, but may have been altered to benefit the adversaries’ goals. These techniques might be used by adversaries to follow through on their end goal or to provide cover for a confidentiality breach.
- Data Encrypted for Impact [T1486]: Encryption of files is the most common form of impact observed. This may include forensics logs and artifacts as well that may inhibit an investigation.
- Service Stop [T1489]: Threat actors often disable services related to detection, or backup replication to maximize the impact of encryption.
- Data Destruction [T1485]: Most of the time, data destruction is aimed at the destruction of forensic artifacts via the use of SDelete or CCleaner. Unfortunately, sometimes ransomware actors destroy production data stores (sometimes malicious, sometimes by accident).
Exfiltration [TA0010] Exfiltration consists of techniques that threat actors may use to steal data from a network. Once data is internally staged, threat actors often package it to avoid detection while exfiltrating it from the bounds of a network. This can include compression and encryption. Techniques for getting data out of a target network typically include transferring stolen data over threat actor command and control channels.
- Exfiltration over Web Service [T1567] is the most common sub-tactic, which covers use of a variety of third party tools such as megasync, rclone, Filezilla or Windows Secure Copy.
Lateral Movement [TA0008]: Lateral Movement by threat actors consists of techniques used to enter and control remote systems on a network. Successful ransomware attacks require exploring the network to find key assets such as domain controllers, file share servers, databases, and continuity assets that are not properly segmented. Reaching these assets often involves pivoting through multiple systems and accounts to gain access. Adversaries might install their own remote access tools to accomplish Lateral Movement or use legitimate credentials with native network and operating system tools, which may be stealthier and harder to track. The two most observed forms of lateral movement are:
- Remote Services [T1021 and T1210], which is primarily the use of VNC (like TightVNC) to allow remote access or SMB/Windows Admin Shares. Admin Shares are an easy way to share/access tools and malware. These are hidden from users and are only accessible to Administrators. Threat actors using Cobalt Strike almost always place it in an Admin share.
- Lateral Tool transfer [T1570]: Primarily correlates to the use of PSexec, which is a legitimate windows administrative tool. Threat actors leverage this tool to move laterally or to mass deploy malware across multiple machines.
Discovery [TA0007]: Threat actors use Discovery techniques to gain knowledge about a target’s internal network. These techniques help adversaries observe the environment and orient themselves before deciding how to navigate the network to achieve their impact objectives. Native operating system tools are often used toward this post-compromise information-gathering objective. The most observed tactics of discovery we observed in Q4 were:
- Network Service Scanning (T1046): Primarily consists of abusing Advanced IP Scanners to identify what network hosts are available.
- Process Discovery (T1057): Tools commonly abused are Process Explorer or Process Hacker, which allow threat actors to check active processes and kill them.
- System Owner/User Discovery (T1033): A tactic used to get a listing of accounts on a system or network such as the use of ‘whoami’ command to identify the username from a system.
- Software Discovery [T1518]: Threat actors enumerate software to determine swhat security measures are present or if the compromised system has a version of software that is vulnerable to further exploitation.
Defense Evasion [TA0005]: Defense Evasion consists of techniques that adversaries use to avoid detection throughout their compromise. Techniques used for defense evasion include uninstalling/disabling security software or obfuscating/encrypting data and scripts. Adversaries also leverage and abuse trusted processes to hide and masquerade their malware. Other tactics’ techniques are cross-listed here when those techniques include the added benefit of subverting defenses.
- Indicator Removal on Host – Clear Windows Event Logs [T1070] involves 2 common event logs that get cleared by threat actors, Security and System. Security primarily records authentication, so if cleared, evidence of new account creations, remote access, or lateral movement can be lost. The System event log is helpful in identifying Service Installations, so if it’s cleared, evidence of any tools being used or stopping of services can be lost. This can be an effective way for a threat actor to cover some of their tracks.
Impair Defenses [T1562] is mainly the uninstallation or removal of antivirus software, or circumvention of anti-tampering configurations on EDR or detections software.
Industries Impacted
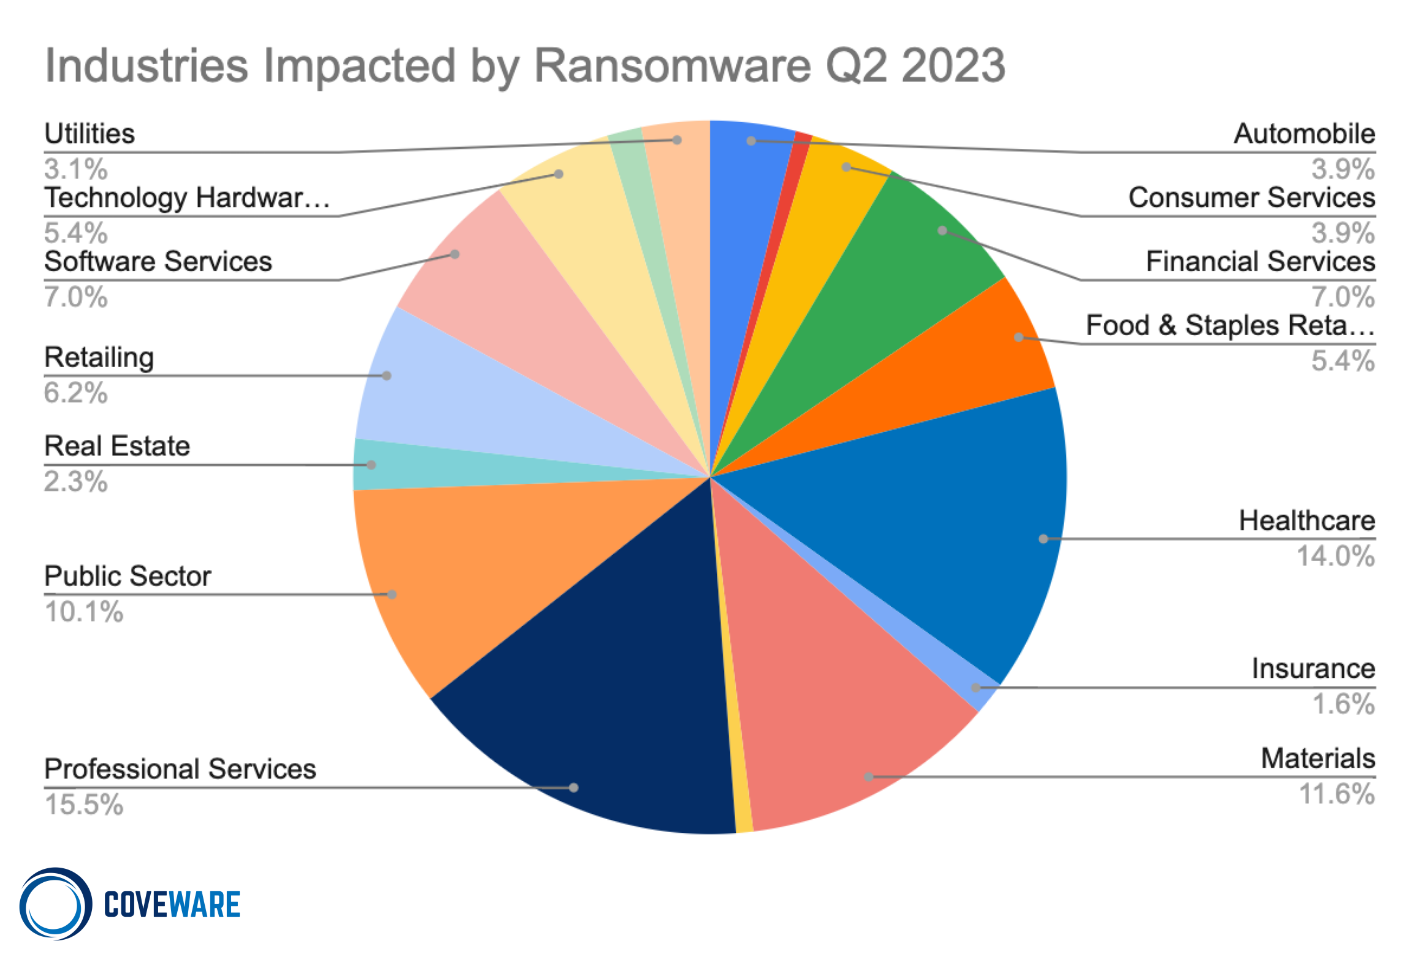
As threat actors further react to shifts in their economic opportunity costs, we expect to see shifts in industry concentrations as well. We still do not expect direct targeting of certain industries, but rather expect certain industries will be more or less exposed to the TTPs financially motivated threat actors use during a given campaign.